The Power Of X
A simple yet powerful lighting technique anyone can master in under a minute.
Yes! Send Me My Free Video
By Tim Park
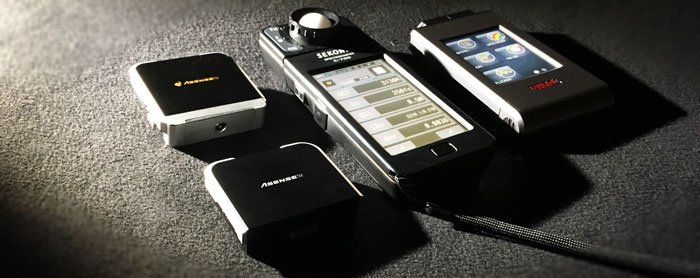
While some filmmakers only measure the color temperature of their lights to set white balance, there are so many other important color characteristics of light that need to be carefully considered to fully assess a light fixture used to illuminate your scene. Fail to address these qualities of your luminaires and you run the risk of finding out in post that your image has uncorrectable color problems. This is why color meters and spectrometers are so crucial on-set.
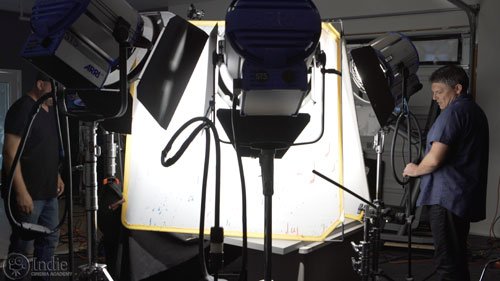
All spectrometers are not the same. Some give lists and lists of information while others just present the basic info of a light. Some meters are very easy and intuitive to use, others require constantly referencing the manual.
To help you decide which spectrometer is best for your needs — whether you are purchasing, renting, or borrowing it — I broke down all the different features of spectrometers. First I’ll go through all the spectral readings that most spectrometers give, and explain how to read them and why they are important. Then I will switch and cover features of the actual device such as user interface, speed of taking a reading, etc.
When I evaluate the color quality of a light, some of the main things I look at are:
• Overall color quality
• Color temperature
• How continuous is the spectrum
• How well the light’s spectrum matches the standard
• Hue shift (green/magenta)
• Specific wavelengths and colors that could be problematic as well as spikes and valleys.
Of course there are also qualities such as brightness, flicker, spread, softness, and throw, but these aren’t color dependent and so simpler meters make more sense. (Some spectrometers and color meters do measure a few of these characteristics, but not all.)
While a larger discussion of these characteristics are beyond the scope of this article, here is a brief description of each.
Various color perception / color indices were created that summarize how well a light renders color. These indices work by comparing specific color samples illuminated by the test light, then comparing them to the same color samples lit under a light standard. The result is a numbered rank with 100 being the best. These indices include CRI (Ra), CRI (Re) (also known as extended CRI), TLCI, CQS, and TM-30-15. (TM-30-15 Rg can go above 100; in that case the closer the value is to 100 the better the light.) We discuss these further in our article “Understanding the Complete LED Database: Testing Procedures.”
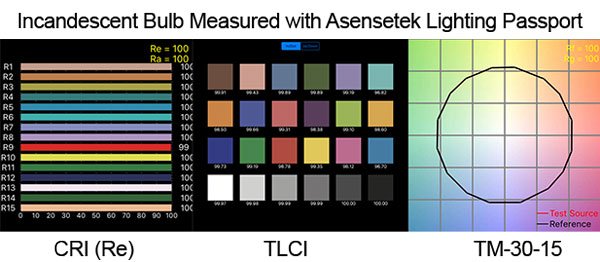
These indices are a great starting point when assessing a light. However, since they are only evaluating a few colors out of millions, and since the final rank is an average of the values of those few colors, these measuring tools can sometimes be VERY misleading. That is why it is crucial to understand what your are looking at so you can find any potential values that could be skewing the final numbers.
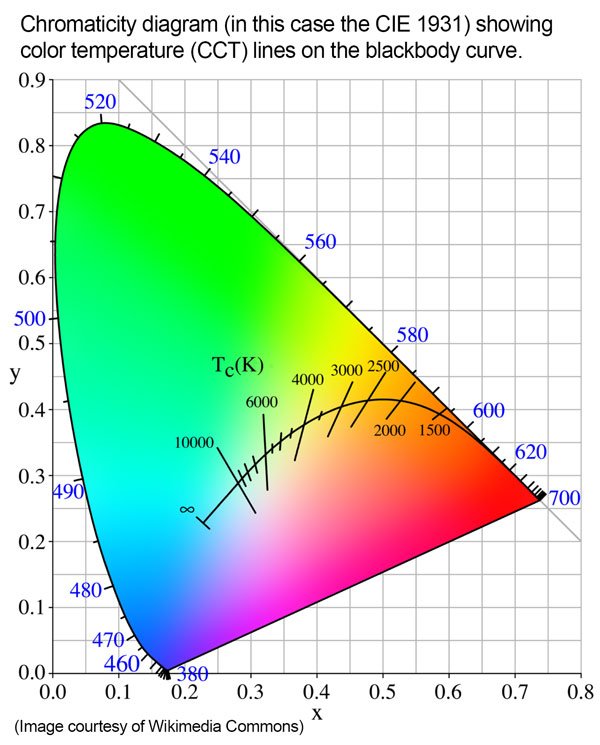
Correlated color temperature (CCT) involves evaluating the spectrum as a whole and plotting the resulting “white point” on a chromaticity diagram which also shows the black body curve (technically referred to as the Planckian Locus). The result is a number with units of Kelvin (K).

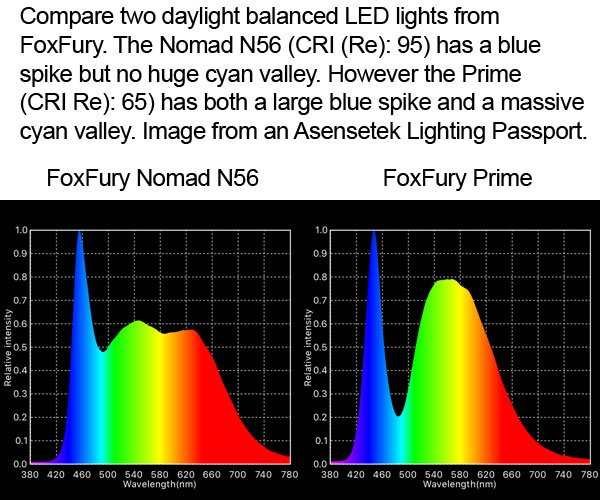
If your light has spikes or valleys (blue, green, magenta, etc), you may still feel like the light has a specific shade of color even when the camera has been white balanced. What you are seeing is real and can greatly affect your image. An example is LEDs, which currently all contain a massive blue spike, which gives all LEDs (especially daylight balanced LEDs) a blue “feel” even when white balanced. We’ll discuss this more in the section “Problematic Colors / Wavelengths.”
Generally how even is the spectrum? Are there sudden spikes or deep valleys? Perhaps certain wavelengths are missing? There are gels on the market that attempt to remove spikes – such as Minus Green and Plus Green – however since gels affect wavelength regions and not only specific wavelengths, they have the problem of reducing too many wavelengths as they tone down spikes.

When dealing with lighting technology that is prone to major spikes (such as HMI and fluorescents) something to pay attention to is the optical resolution of your spectrometer. Certain spikes are so narrow that some spectrometers with lower optical resolution will not represent them correctly or may miss them completely. We noticed this with low quality HMIs and fluorescent lights when we were comparing different spectrometers. (See Accuracy section below.)
While the color temperature involved plotting the light as a whole onto the black body curve, a lot of important aspects of the light were ignored in the process since that calculation involved averaging. So I like to see how well each wavelength matches the standard at that color temperature.
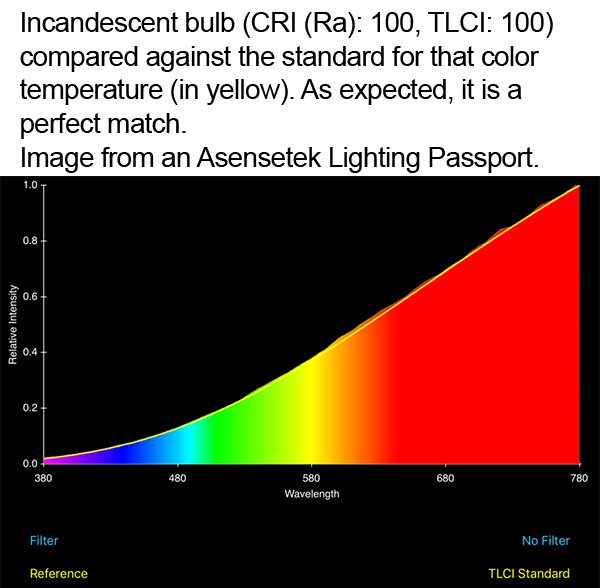
Some lights closely match the standard, while others match in only some of the regions. It’s important to notice which regions are not matching well in case your scene has colors then involve those wavelengths. An example is the cyan region with LED fixtures.

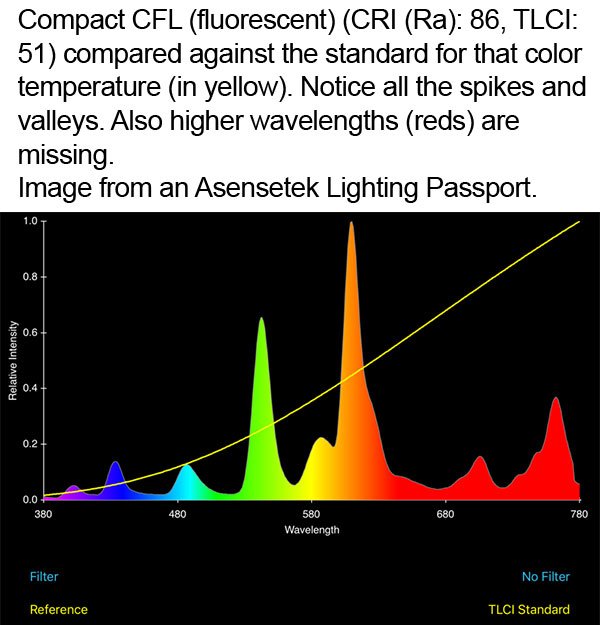
Something important to realize when looking at color spectra is the y-axis — the values going vertically — is a relative scale that goes to 1.0. The wavelength that has the highest intensity is set to 1.0, and the relative intensities of all the other wavelengths are based on that.
A lot that can be learned by comparing the spectra of two lights both before and after normalization. (Normalization means that the most intense wavelength from both lights is still set to 1.0 even if one light isn’t as bright as the other.)
When two lights are normalized, the emphasis is on how well the spectra match. When normalization is turned off, the emphasis is on how the intensity of each light contributes to lighting the subject.
You can also use this feature to see how much a gel affects a light, in which case you are comparing the light before and after adding the gel.
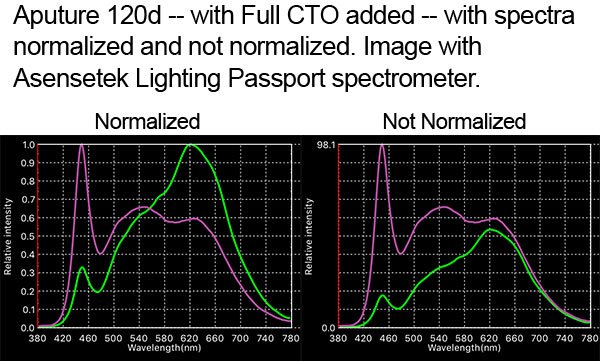
In this example of adding Lee Full CTO (green trace) to an Aputure 120d LED light (violet trace), you can see how much the color temperature orange gel affects the spectra. In the normalized graph you can see how the entire spectra was rebalanced. In the not normalized graph you can see how much the CTO gel decreases the intensity of ALL wavelengths. The longer wavelengths (orange and red) are barely filtered while the blues and green wavelengths are greatly filtered. This is why gelling a light decreases its brightness.
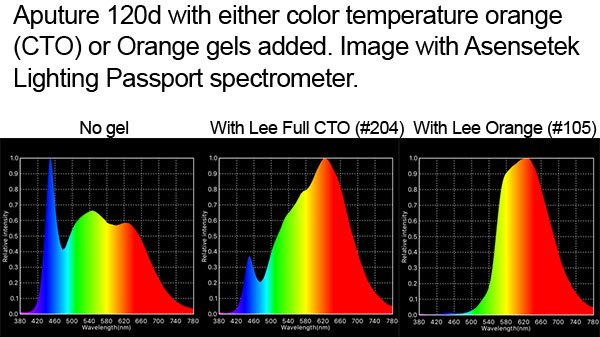
As a side note about adding Full CTO: when a color temperature orange (such as Lee CTO #204) gel is added to a light (in this case the Aputure 120d LED), it isn’t that “orange is added” to the light, it is that the entire spectrum is rebalanced, changing the relative intensities for ALL of the wavelengths so that the light better matches the standard for tungsten balanced light. (In fact, as you saw in the non-normalized graph, the opposite of “orange added” happens: everything but orange is subtracted.) If CTO only “added orange,” then only the orange region of the spectrum would change. But this would create a huge spike or hump depending on how specific the gel was. You can see this when an Orange gel (such as Lee Orange #105) is added to the same light.
Hue shift specifically looks at green or magenta shifts in your light. Spectrometers report this as duv, which is short for “delta uv.” (In science, “delta” refers to “change.”) The light’s “white point” is plotted on a chromaticity diagram. Then a line is drawn perpendicular to the blackbody curve to the light’s white point. The distance from the white point to the black body curve along this perpendicular line is the amount hue shift.
• Negative duv: there is a general magenta shift
• Positive duv: there is a general green shift
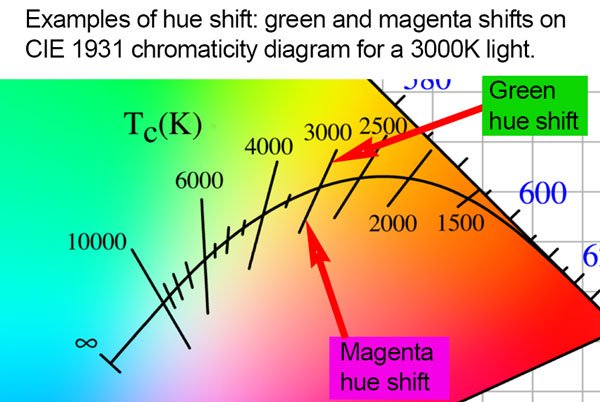
Notice I said “general”; green and magenta spikes can affect this value too but brings in a different issue. Correcting duv from general shifts may improve your green/magenta values AND your color quality. However if the shift is caused by green or magenta spikes, attempting to correct them can hurt your overall color quality because you are also affecting other wavelengths around the spike. (“Collateral damage.”) So you should understand if the hue shift is from a general trend or a spike/valley.
Some lights struggle to reproduce certain colors, or have spikes and valleys. As we saw above low quality HMI lights have spikes everywhere. Low quality fluorescents are even worse. The absolute worst are sodium vapor lamps.
As a result, specific colors can be very bad even if the rest of the colors from that light are great. With LED lights, saturated red (R9) and saturated blue (R12) are difficult to reproduce although LED manufacturers are finding ways to improve those values using special phosphors. I also look to see how big the blue spike and how deep the cyan valley is with LEDs. The green spikes from low quality HMIs can really ruin skin tones since it is hard to filter spikes.
Spectrometers use different technologies to measure the color quality of light. Some instruments simply filter the RGB channels just as most cameras do. However this is probably the least accurate way to measure color quality and the results tend to be gross approximations.
More accurate spectrometers use technologies such as linear variable filters and diffraction gratings. These isolate each wavelength individually. In fact you can build your own spectrometer using a $2 diffraction grating slide or use a handheld diffraction gratings spectroscope for $7 to observe different spectral lines directly with your eyes.

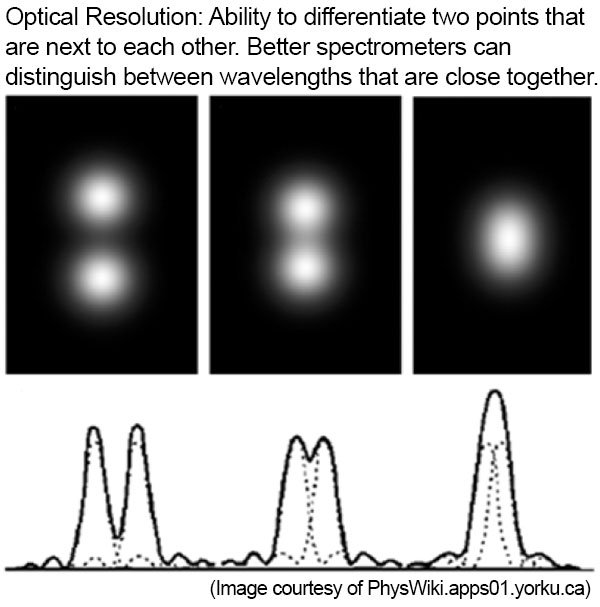
With higher accuracy comes increased optical resolution. This is the ability to differentiate between different wavelengths that are close to each other. However even this has it’s limits. Many good spectrometers can differentiate wavelengths that are 12nm apart, depending on where those wavelengths are on the spectrum. Some spectrometers can get up to 8nm optical resolution. This is important when dealing with lights that have spikes such as HMI and fluorescents since some of those spikes might be completely missed with lower optical resolution spectrometers. (We ran into this when testing low quality HMIs.)
Accuracy is also seen when looking at luminance and CCT values. Common accuracies for these are around plus or minus 3 to 5 percent for luminance, 2 to 3 percent for CCT, and 1 to 2 percent for CRI.
This is why multiple readings with a meter might be slightly different, or when comparing results between different meters. These slight differences shouldn’t greatly affect your image. For example 3% variance of the color temperature of a 5500K daylight fixture would mean that it might be 150K off. In comparison a 1/8 CTO gel would change the temperature to 4900K, which is a 600K drop.
Like with all tools and instruments, spectrometers needs to be easy to use. This means easy to take measurements, easy to review the results, and easy to save the information for later.
The interface should be functional, easy to push buttons and move around within the app or software. It should respond quickly, and have graphics that are rich with information.
The menu set-up should make sense, making you able to get to the pages and information quickly and intuitively. Ideally there would be very few steps to get through the pages, possibly by having a lot of information on each page. This means efficiently designing each page so it can cleanly display a lot of information.
Workflow in any program or app is important. No one likes to have to go through numerous steps, many menus, and take a lot of time at each point just to take a color reading.
This is the common workflow of most spectrometers:
All meters take a little time to turn on often just a few seconds, since they are little computers. Dark calibration often is required during this step simply by putting a cover over the sensing window on the meter. However not all spectrometers require this step since it may be automatic.
Since spectrometers can measure many different characteristics, there will be a menu allowing the user to select what to measure. The ideal spectrometer would be one that measures everything and the user sorts through the results at will. However many spectrometers require the user to specifically select what to measure. A few even require the user to take separate measurements for each characteristic, which can be time consuming.
Measurements can be fast for very bright lights taking only a few milliseconds. However dimmer lights can take 10 or more seconds before the measurement is complete.
Very often the user will want to save the measurement so it can be reviewed later, possibly to compare the reading with other lights. Meters have different ways to save the information. Some save it to internal memory, others allow the user to email it somewhere. Some allow both. File names have limitations on certain meters, others allow for very long file names.
Now that the user has measured multiple lights, some spectrometers allow them to be compared both graphically and via a table.
The ease of retrieving saved data is important especially when you are searching for “that one light.” Some meters are very quick to get to the memory, others are a bit more convoluted.
As mentioned above, eventually the user will want to share the results. The easiest method is via email. However if that is not an option, then the next option often is either plugging the meter into a computer or transferring a SD card to a computer.
If the spectrometer is going to determine how far off the measured light is from the color temperature the user is aiming for, then there will be a step to input a CCT value. This often happens when the meter is programmed to suggest gels and filters to modify the measured light to reach the desired color temperature.
Some meters have additional options to get additional information such as flicker, hue shift gel corrections, camera filter corrections, etc.
Like most tools, spectrometers are best when they are easy to have on set. Not big and bulky, but small and easy to throw in your bag. Not heavy either. It should also fit in your hand well. Since many quality spectrometers use a diffraction grating to split out the different wavelengths, there is a limit to how small the meter can be.
I hope you now see that understanding color spectrometry is fairly straightforward and full of important information that can affect your video or film project. While most quality spectrometers are not cheap, they are definitely devices that you’ll want to have on-set once you start working bigger projects.
Are there any aspects of spectrometers that I failed to discuss? Or perhaps you would like additional clarification on a measurement or feature? Just leave a comment below and we will be sure to answer!
 https://indiecinemaacademy.com/wp-content/uploads/2015/11/AlexaEpicBlackmagic-web.jpg
211
800
Ryan E. Walters
https://indiecinemaacademy.com/wp-content/uploads/2013/12/Indie_cinema_Logo_2color-MF-300x116-web.png
Ryan E. Walters2015-11-04 17:53:112018-01-25 10:53:37The Problem With The Digital Camera Look & My Solutions To Correcting It
 https://indiecinemaacademy.com/wp-content/uploads/2015/10/Thumbnail-EasyDay-01-web.jpg
337
800
Ryan E. Walters
https://indiecinemaacademy.com/wp-content/uploads/2013/12/Indie_cinema_Logo_2color-MF-300x116-web.png
Ryan E. Walters2015-10-14 00:15:332018-01-25 10:49:33Three Lighting Tips For Your Next Action Film
 https://indiecinemaacademy.com/wp-content/uploads/2015/09/LC115_12Questions-Thumbnail-Free-Web.jpg
450
800
Ryan E. Walters
https://indiecinemaacademy.com/wp-content/uploads/2013/12/Indie_cinema_Logo_2color-MF-300x116-web.png
Ryan E. Walters2015-09-07 00:30:532015-10-30 19:06:3612 Crucial Questions To Ask Before You Light Your Set (Cinematic Lighting Lesson 15)
 https://indiecinemaacademy.com/wp-content/uploads/2015/08/LC114-3StrLightingNghtExt-Thumbnail.jpg
450
800
Ryan E. Walters
https://indiecinemaacademy.com/wp-content/uploads/2013/12/Indie_cinema_Logo_2color-MF-300x116-web.png
Ryan E. Walters2015-08-24 00:30:112015-10-30 18:55:173 Strategies for Lighting Your Night Exteriors (Cinematic Lighting Lesson 14)
 https://indiecinemaacademy.com/wp-content/uploads/2015/08/LC112_5SratDayExt-Thumbnail-800x450-jpg-web.jpeg
450
800
Ryan E. Walters
https://indiecinemaacademy.com/wp-content/uploads/2013/12/Indie_cinema_Logo_2color-MF-300x116-web.png
Ryan E. Walters2015-08-10 00:15:422015-10-30 18:54:545 Essential Strategies To Lighting Day Exteriors (Cinematic Lighting Lesson 12)
 https://indiecinemaacademy.com/wp-content/uploads/2015/07/LC113-10TricksDayExt-Thumbnail-800x450-web-.jpg
450
800
Ryan E. Walters
https://indiecinemaacademy.com/wp-content/uploads/2013/12/Indie_cinema_Logo_2color-MF-300x116-web.png
Ryan E. Walters2015-07-27 00:15:252015-10-30 18:55:0310 Tips To Lighting Day Exteriors (Cinematic Lighting Lesson 13)
 https://indiecinemaacademy.com/wp-content/uploads/2015/07/LC123_SmallCommercial-thumbnail-800X450.jpg
450
800
Ryan E. Walters
https://indiecinemaacademy.com/wp-content/uploads/2013/12/Indie_cinema_Logo_2color-MF-300x116-web.png
Ryan E. Walters2015-07-13 14:24:582015-10-30 19:19:44How To Light A Small Commercial (Cinematic Lighting Lesson 23)
 https://indiecinemaacademy.com/wp-content/uploads/2015/07/AR015_LEDRuinProduction-Thumbnail-Web.jpg
450
800
Ryan E. Walters
https://indiecinemaacademy.com/wp-content/uploads/2013/12/Indie_cinema_Logo_2color-MF-300x116-web.png
Ryan E. Walters2015-07-06 01:00:122018-01-25 10:49:13Are LEDs Ruining Your Projects? [VIDEO]
 https://indiecinemaacademy.com/wp-content/uploads/2015/06/LC126_LightingShortFilm-Thumbnail-Web.jpg
450
800
Ryan E. Walters
https://indiecinemaacademy.com/wp-content/uploads/2013/12/Indie_cinema_Logo_2color-MF-300x116-web.png
Ryan E. Walters2015-06-15 12:00:042016-10-10 07:59:55How To Light A Narrative (Cinematic Lighting Lesson 26)
https://indiecinemaacademy.com/wp-content/uploads/2015/06/LC126_LightingShortFilm-Thumbnail-Web.jpg
450
800
Ryan E. Walters
https://indiecinemaacademy.com/wp-content/uploads/2013/12/Indie_cinema_Logo_2color-MF-300x116-web.png
Ryan E. Walters2015-06-15 12:00:042016-10-10 07:59:55How To Light A Narrative (Cinematic Lighting Lesson 26)You must be logged in to post a comment.
This site uses Akismet to reduce spam. Learn how your comment data is processed.
This site uses cookies. By continuing to browse the site, you are agreeing to our use of cookies.
AcceptHide notification onlySettingsWe may request cookies to be set on your device. We use cookies to let us know when you visit our websites, how you interact with us, to enrich your user experience, and to customize your relationship with our website.
Click on the different category headings to find out more. You can also change some of your preferences. Note that blocking some types of cookies may impact your experience on our websites and the services we are able to offer.
These cookies are strictly necessary to provide you with services available through our website and to use some of its features.
Because these cookies are strictly necessary to deliver the website, refusing them will have impact how our site functions. You always can block or delete cookies by changing your browser settings and force blocking all cookies on this website. But this will always prompt you to accept/refuse cookies when revisiting our site.
We fully respect if you want to refuse cookies but to avoid asking you again and again kindly allow us to store a cookie for that. You are free to opt out any time or opt in for other cookies to get a better experience. If you refuse cookies we will remove all set cookies in our domain.
We provide you with a list of stored cookies on your computer in our domain so you can check what we stored. Due to security reasons we are not able to show or modify cookies from other domains. You can check these in your browser security settings.
We also use different external services like Google Webfonts, Google Maps, and external Video providers. Since these providers may collect personal data like your IP address we allow you to block them here. Please be aware that this might heavily reduce the functionality and appearance of our site. Changes will take effect once you reload the page.
Google Webfont Settings:
Google Map Settings:
Google reCaptcha Settings:
Vimeo and Youtube video embeds:
You can read about our cookies and privacy settings in detail on our Privacy Policy Page.
Privacy Policy
Awesome
It’s so cool that you talked about color spectrometry in the cinema industry. Recently, my sister mentioned she’s thinking about pursuing a career in cinema production. My sister’s reading a lot about movie coloring, so I think this article could interest her. Thanks for the information on color theory and how it affects a film.
Glad our article is helpful to your sister. Color science is very interesting and is more complex than people realize. We are currently researching and writing some lessons on important aspects of color that filmmakers need to know as they light their scenes.