The Power Of X
A simple yet powerful lighting technique anyone can master in under a minute.
A simple yet powerful lighting technique anyone can master in under a minute.
by Tim Park
We packed our 2016 LED Database full of useful information about the color quality of over 165 LED lights on the market. To be as complete as possible, we felt it important to explain not only how we conducted our color measurements, but also how to quickly read and understand all that color data.
So continue reading below to learn more about the LED database. If you want to skip ahead and get to the results, head on over to Page 2:
Ranking: The scale includes many lights that are tied for the same rank. So it is best to NOT count down the list and say that one LED light is ranked two higher than another without considering if those two lights are ranked the same. (For more on why so many ranked the same, read the section below titled “Ranking the Lights.”)
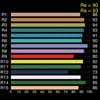 Histogram: Here extended CRI is separated out by each of its R-values, R1 through R15. Pay specific attention to the R9 and R12 values, since LED lights have a hard time accurately reproducing these colors. With bicolor lights, the R9 value can greatly dip (depending on the brand of light) between the two extremes (such as a color temperature of 4000K), sometimes as much as a 10% decrease.
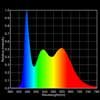 Spectrum: With LEDs there is almost always a huge peak at 450 nm followed by a dip around 470 nm. Depending on the quality of the LED, the peak and dip may be big or small. Ideally both will be as small as possible, although with daylight balanced lights a big peak followed by a small dip is normal. The spectrum should also be relatively broad since the tungsten and daylight light the LED is mimicking is also broad. Lower quality lights will have narrower spectra, resulting in a lack of reds above 620 nm, as well as missing colors between 450 nm and 500 nm.
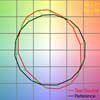 TM-30-15 (Rf and Rg). TM-30-15 averages together 99 color samples. When looking at the color vector graphic for a high quality light, the red circle should completely trace the black reference circle. An oblong red trace means the colors are very skewed, something that might not be obvious when those values are averaged together to give you a numerical value. This is why comparing the TM-30-15 graphics are so important. The green arrows show hue-shifts in that area. Rf measures color fidelity while Rg measures the color gamut. The closer these are to 100, the better.
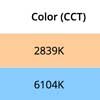 Color (CCT): Correlated Color Temperature tells what “version” of white the light is. The temperature is correlated (or compared) to a blackbody radiator at the given temperature kelvin. Tungsten balanced light is close to 2800K, while daylight balanced light is around 5600K. The color temp is included in the database so that you can compare lights of the same temperature. (Note: The standard used to measure CCT is different above and below 5000K. As a result you will probably see a jump or drop in certain R-values right at 5000K.)
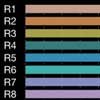 CRI (Ra): The Color Rendering Index measures how well the light renders eight Munsell color samples, R1 through R8. The maximum value is 100, with 100 being best.
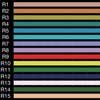 CRI (Re): The Extended Color Rendering Index includes seven additional colors to the eight used with standard CRI, for a total of 15 colors, R1 through R15. The maximum value is 100, with 100 being the best. (Note: colors for Extended-CRI are named below.)
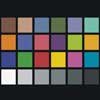 TLCI: The Television Lighting Consistency Index averages 24 colors from the MacBeth chart (which is now owned by X-Rite and is called the X-Rite ColorChecker). The maximum value is 100, with 100 being the best. (Note: colors for TLCI are named below.)
CQS: The Color Quality Scale uses 15 saturated Munsell color samples to determine its value. (The colors used are not the same 15 colors used for CRI (Ra) or CRI (Re).) The maximum value is 100, with 100 being the best.
Rf and Rg: See TM-30-15 above.
Values in both CRI (Ra) and CRI (Re)
R1 = Light Greyish Red (low saturation)
R2 = Dark Greyish Yellow (low saturation)
R3 = Strong Yellowish Green (low saturation)
R4 = Moderate Yellowish Green (low saturation)
R5 = Light Blue (low saturation)
R6 = Bluish Green (low saturation)
R7 = Violet (low saturation)
R8 = Reddish Purple (low saturation)
Additional Values in CRI (Re)
R9 = Red (saturated)
R10 = Yellow (saturated)
R11 = Green (saturated)
R12 = Blue (saturated)
R13 = Skin Color (Light)
R14 = Leaf Green
R15 = Skin Color (Medium)
Dark Skin, Light Skin, Blue Sky, Foliage, Blue Flower, Bluish Green,
Orange, Purplish Blue, Moderate Red, Purple, Yellow Green, Orange Yellow,
Blue, Green, Red, Yellow, Magenta, Cyan,
White, Neutral 8, Neutral 6.5, Neutral 5, Neutral 3.5, Black
To learn more about these color evaluation scales, check out our discussion about if CRI is the right tool for CRI.
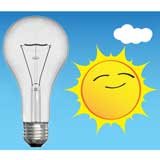
For comparison, here are color measurements of an incandescent bulb (tungsten) and daylight (on a cloudy afternoon) using the Asensetek Lighting Passport spectrometer. (These are NOT the standards that the spectrometer is calibrated to.)
 |
Tungsten/Daylight Samples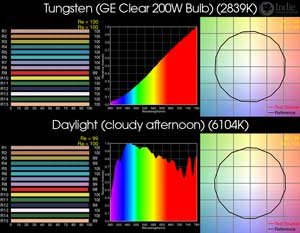 |
||||||
| Rank | Color (CCT) | CRI (Ra) | CRI (Re) | TLCI | CQS | Rf | Rg |
| 100.0 | 2839K | 99.8 | 99.7 | 100.0 | 99 | 100 | 100 |
| 6104K | 95.5 | 99.4 | 100.0 | 99 | 99 | 100 | |
Incandescent light from a tungsten filament results in very reliable color. In fact, I took readings from three brands and wattages of bulbs (Philips 60W Soft White, Ace 100W Soft White, and GE Clear 200W) and all measurements and graphics were basically identical.
Daylight is a tricky one. The Correlated Color Temperature is different depending on time of day and what is in the sky, such as clouds, haze, and smog. Blue sky is also very different than direct sunlight. (I’ll be adding these color readings and graphics as I collect them.)
All measurements were taken with the Asensetek Lighting Passport SMART Spectrometer synced to the Spectrum Genius Mobile App. All graphics and data are straight out of the color meter app and have not been altered or adjusted other than to place into one graphic for easy viewing.
For those specifically interested in TLCI, Asensetek has a specific app that syncs with the Lighting Passport and analyzes the TLCI information: Asensetek Spectrum Genius Studio.
A majority of the color readings were taken at NAB 2016 in the Central Hall of the Las Vegas Convention Center. Measurements taken at a different location are labeled as such.
Why a convention center? Because nearly all LED lighting manufacturers that make lights for film and video work – big and small – are present. There are some LED manufacturers on the list that are brand new, and others that are not sold in the United States. These would be much harder to get demo units to test if we didn’t test them at a trade show.
“Won’t the convention hall lights affect the results?”
We tested the convention hall lights and they are so much dimmer than the lights we were testing that there was nearly no effect. We tested this various ways: one way was to compare the color reading of a sample light with and without using the background subtraction setting built into the Asensetek Lighting Passport. A second method was to test the light levels of the convention hall lights compared to the light levels of a sample light.
Additionally, all lights are being subjected to the same convention hall lights, so if there were any contamination, all lights would experience it nearly equally.
“Your readings are different than our readings”
This may be due to a number of factors. Lighting companies often bring the very best of their inventory to the trade show (what is known as “cherry picking”). Or it could be a quality control issue between the different batches of LED emitters used. (This can actually be pretty substantial from lot to lot.) Also, as can be seen when comparing the lights this year with the same models last year, LED technology is constantly improving. So it is possible you have a different generation of light.
We spent some time developing a fair and impartial ranking method. From the outset we knew that even after narrowing the focus to just color quality, it was going to be very difficult to apply the method to 165 lights. A light might rank high according to one color scale, but not as well on another scale. It might have accurate color rendition for most colors, yet fail miserably with one or two colors. Bicolor lights throw a completely different element into the mix. A bicolor light might have excellent color at the tungsten end of the scale, but does a terrible job on the daylight end.
Our solution was to look at all color scales. So our ranking is the average of extended-CRI (Re), TLCI, and CQS, which is then rounded up to the nearest 0.5. The logic behind this method is that each of these color scales is evaluating different parts of the spectrum, and so averaging them together will hopefully bring in more aspects of the spectrum. If one color scale greatly disagrees with the other two scales, it is pretty safe to conclude that there is some issue with the color that the other two scales might be missing.
For bicolor lights, the tungsten and daylight values of extended-CRI, TLCI, and CQS were all averaged together. The thought is that if one end of the scale has very low results, it really isn’t that useful of a bicolor light and as such should have a lower ranking. Perhaps a better option would be to buy the single color version of that light, if it is available.
There is also the issue of how averages can mask outlier values. For example LEDs are known to struggle with the R9 and R12 within the extended-CRI scale. Even within the extended-CRI value, this problem often gets lost. It is also why CRI (Re) values are nearly always lower than CRI (Ra) values. In fact, the R1 through R8 values of the CRI (Ra) are nearly always pretty similar, so that average really doesn’t help that much.
“Why aren’t the CRI (Ra) or TM-30-15 color scales included?”
We didn’t include CRI (Ra) because there was too much overlap with CRI (Re). This would give the CRI scales too much weight in the ranking.
The Rf and Rg values of TM-30-15 were not included because we didn’t want to dilute the other scales even more. Additionally the Rg value can go above 100, which would make the averaging of the other scales mathematically incorrect since they can’t go over 100. However, graphically the TM-30-15 gives A LOT of interesting information, so we still included it so that you can still use it in your personal evaluation of a light.
“Why were the rankings rounded up to the nearest 0.5?”
As with all measurements, there is a certain amount of error: the measurement device, electronic/light noise, the emitters of the LED, and the human doing the test. So we felt that 0.5 was a good place to round to since more decimal points than that are probably just noise.
Plus, does it really make a difference if the light is ranked 0.1 different than another light? The CRI or TLCI or CQS of the light could be 3.0 different (or more) and most people wouldn’t even notice.
“But there are multiple lights within the same ranking.”
Exactly. The results of all the lights within the same ranking are essentially the same. While it is true that some LED lights might have individual color readings that are very good or very bad — for example the R9 value — often resulting in them being upgraded or downgraded in a normal ranking system, we chose to leave them be so as to not overly influence and bias the ranking. Different people value certain color scales or color values more than others, and so if we downgraded a light because it had very bad R9 values, someone else might have issue with it since they don’t care about skin tones and red fruits and vegetables.
“What is NOT included in the ranking?”
Everything unrelated to color quality. This includes build quality, durability, power source, how it is mounted on-set, softness/hardness of the light, beam angle, ease in controlling color temperature and brightness, price, etc. All of these factors would affect price, which explains why some lights high on our scale are inexpensive and why others farther down are more expensive. We leave it up to you to decide if these characteristics are important to you.
The goal of this database was to be complete. We debated separating the lights by their color or function: tungsten in one list, daylight in another, bicolor in yet another. Panel lights in this list, point source lights in another, flex/ribbon lights in yet another, and then another list for the bulbs.
Since there are so many ways to splice and dice this list, we decided to let you the reader figure that part out. And that is where the beauty of ranking the lights solely based on color quality comes in instead of ranking each light against each other. If you remove, for example, all of the daylight-balanced LED lights from the list, the ranking stays the same. Our database isn’t to say, “My light is better than your light,” but instead to say, “This group of lights are all good.”
Also, don’t immediately discount the lights lower down on the list. For some of those, amazing color quality is not their objective. Instead they might be trying to create a very bright light for arenas or stage shows where color isn’t as important. Some lights in the middle might be super soft, even lights without the staccato effect seen in LEDs with hundreds and hundreds of diodes.
Don’t agree with how we ran our tests? Think there is a better way to parse out the numbers? Do you think we left some aspect of color quality out? Please let us know. We really want this to be as useful of a list as possible, and appreciate everyone’s input.
You must be logged in to post a comment.
This site uses Akismet to reduce spam. Learn how your comment data is processed.
This site uses cookies. By continuing to browse the site, you are agreeing to our use of cookies.
AcceptHide notification onlySettingsWe may request cookies to be set on your device. We use cookies to let us know when you visit our websites, how you interact with us, to enrich your user experience, and to customize your relationship with our website.
Click on the different category headings to find out more. You can also change some of your preferences. Note that blocking some types of cookies may impact your experience on our websites and the services we are able to offer.
These cookies are strictly necessary to provide you with services available through our website and to use some of its features.
Because these cookies are strictly necessary to deliver the website, refusing them will have impact how our site functions. You always can block or delete cookies by changing your browser settings and force blocking all cookies on this website. But this will always prompt you to accept/refuse cookies when revisiting our site.
We fully respect if you want to refuse cookies but to avoid asking you again and again kindly allow us to store a cookie for that. You are free to opt out any time or opt in for other cookies to get a better experience. If you refuse cookies we will remove all set cookies in our domain.
We provide you with a list of stored cookies on your computer in our domain so you can check what we stored. Due to security reasons we are not able to show or modify cookies from other domains. You can check these in your browser security settings.
We also use different external services like Google Webfonts, Google Maps, and external Video providers. Since these providers may collect personal data like your IP address we allow you to block them here. Please be aware that this might heavily reduce the functionality and appearance of our site. Changes will take effect once you reload the page.
Google Webfont Settings:
Google Map Settings:
Google reCaptcha Settings:
Vimeo and Youtube video embeds:
You can read about our cookies and privacy settings in detail on our Privacy Policy Page.
Privacy Policy
Just had your site sent to me. A run and gun test at NAB is hard for me to believe total accuracy. Lighting, camera, audio Manufacturers do extensive testing in controlled and non controlled lab environments. I use a UPR Tek spectrometer for every demo/sale. I found recently these meters are not accurate after about a year of use and is recommended to have the device sent back for recalibration. I just did this. Also I measure from reflected light, just like what the camera will see. Extremely difficult to get accuracy at a convention hall like you have done. My reading completely disagree with yours. Plus you only sampled one light? Why? there is also another issued ignored and that how the light matches to the same light in a completely lighted set. This helps avoid stacking the deck with best light at the moment. Finally, longevity, power consumption, warranty and of course price is needed to be considered in your rating. Just sayin. Happy to send my lights to test too.
Thank you for your thoughts. While a completely controlled environment is ideal for the tests we run, creating as extensive of a list possible for this database required taking measurements at NAB. However, we did numerous tests of the NAB environment prior to collecting individual data of various brands and found that the convention hall did not significantly influence our readings. Additionally we talked with gaffers and DPs during the environmental tests, and all agreed that due to the inverse square law as well as even lighting within the hall, along with proximity to the light being tested, that our tests were sound. People are free to disagree, but we stand confidently behind our measurements.
While reflected light is what cameras see, this adds in the variable of the object the light is reflecting off of. Therefore taking measurements of light directly from the light source reduces this influence. Measuring directly from the light is very common in the industry, so we stuck with that method.
I’m sorry that your UPR Tek needed to be recalibrated. When we wrote our article “Can You Trust Your Color Meter” we ran concurrent tests between the Sekonic C-700, UPR Tek MK350, and Asensetek Lighting Passport and determined that the Lighting Passport was the most reliable and gave the most amount of information. At NAB many of the LED manufacturers also use the Lighting Passport, and when they let us see their internal documents their measurements consistently agreed with our measurements. Again, another confirmation that our tests are reliable.
At trade shows companies often bring the very best of their inventory, so it is safe to assume that all readings taken at NAB were skewed in the positive direction. Perhaps this is why our readings don’t match yours.
Testing a light in a “completely lighted set” negatively influences a color quality test since you no longer are testing the sample light, instead testing many types and brands and models of lights as they reflect around the environment.
As mentioned in the above article, this database is ranking lights ONLY based on color quality. There are plenty of other reviews where you can find rankings based on other characteristics. Very few (read: “none”) refer to color quality since many reviewers don’t have the knowledge or tools to conduct color tests. So we decided to focus on the color information that those other reviewers lack, information that most gaffers and DPs find to be the most important. A light might have longevity, efficient power consumption, a lengthy and inclusive warranty, and a low price, but have TERRIBLE color quality making the other features of the light pointless.
All in all, your Cool-Lux light did decent and is ranked in the top half of our database. I would consider this a good light! If you’d like us to test it again, we’d be happy to do so in our controlled environment.
Testing lights at NAB does have its drawbacks though. Since you only get to test one or two samples, you can’t really judge consistency across the product line, or determine if the products displayed at NAB are cherry-picked samples. I recently purchased 3 lights ranked high on your list, but when I tested them, they varied by as much as 10 points on critical values (R9, R13, R15), so I returned them.
I ended up buying a set of Dracast LED1000 Plus lights – astonishing performance when measured with my C700R, very consistent across the dimming range and the three lights are within a few points of each other. AND they cost the same as the ones I returned! You should add them to your database.
Sorry the ones you bought had such poor quality control. That is another very important issue: LED binning. By methodically grouping dissimilar LED emitters, the end product can still be consistent and high quality. However, if the manufacturer doesn’t bin the emitters, the end product can have huge variance. LED binning has been around for awhile, yet some companies cut so many corners that they still don’t do it.
I consistently hear good things about Dracast lights. I tested a Dracast LED1000 Plus a few months back and got great results: CCT: 5390K; CRI (Ra): 97; CRI (Re): 94; R9: 88; R13: 99; R15: 97. It’s in a large group of other lights I tested, and I’m slowly working through them to add them to the database.
You are right that the lights we test at NAB could have been cherry picked. It probably is true of many of the brands. But even if we get demo units from third parties (B&H Photo, Samy’s, Adorama, Amazon, etc), we would have to get 5 to 10 lights to really make sure the tests were properly sampled. It already is a lot of work to test and publish one light (doubly so if it is a bicolor light), so sorry to say that probably won’t happen anytime soon. This database is more to roughly categorize the quality of the lights, which is why they are grouped into segments every 0.5 values.